Fibonacci Trading
In this lesson, we will have a look at Fibonacci retracement numbers and the meaning behind them.

Fibonacci retracements
The Fibonacci retracements are one of the most popular tools in technical analysis. They came up
from the Fibonacci sequence of numbers. These are 0, 1, 1, 2, 3, 5, 8, 13, 21, 34, 55, 89, 144…
If we divide two numbers next to each other from number three and above, we will gain a certain
ratio we can use from Fibonacci retracement levels. Fibonacci retracement levels can then be
used as horizontal support and resistance areas. And they are created by using a Fibonacci
retracement tool which is available with pretty much every trading software and plotting it from
key swing highs and swing lows. Once we plot those, we will see 23.6, 38.2, .50, 61.8, and 100%
retracement numbers.
Why do these numbers work
There is no magic behind that; it is simply because dozens of traders watch them, so we tend to
see a reaction once the price reaches them. The most important ones are 38.2, 50 and 61.8%
retracement levels. The 61.8% retracement is also called the golden ratio, and it is the most
important one. A 50% retracement is not technically a Fibonacci number, but it is used because
it works.

As we can see on this chart, this is a daily EURUSD chart where we plotted a Fibonacci
retracement tool on key swing highs and swing lows. Once the price starts its retracement, we
could find a buying opportunity between 61,8 and 50% retracement. Another way of using Fibonacci
numbers is with a Fibonacci extension.
Fibonacci extension
This Fibonacci extension can predict future support and resistance levels in trending markets.
This extension tool is pulled from major swing moves, and it is beneficial with instruments in
price discovery. In other words, instruments that are beyond their previous all-time high.

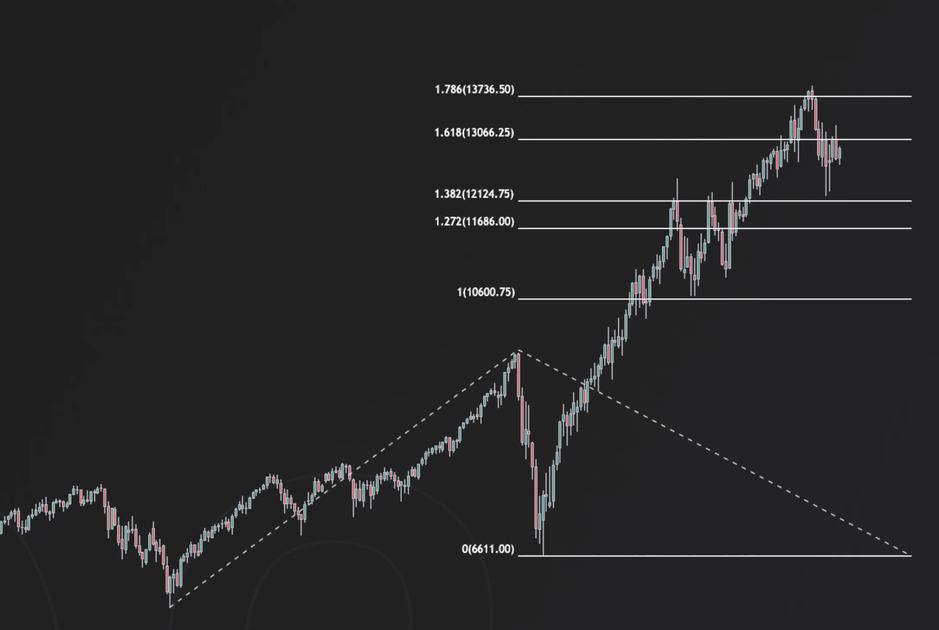
If we take this NASDAQ chart, we can see that the Fibonacci extension was pulled from the whole
2020 March crash. It could show us important levels of support and resistance in play after
NASDAQ broke its all-time high. In conclusion, Fibonacci retracement and extension can be
useful, but it is not the holy grail in trading. These levels oftentimes get front-run or broken
through, so practising good risk management is always the key
empty message
empty message
empty message
empty message
empty message

